A decent way too go through log files can come handy in various ways. From debugging bugs, investigating problems on production environment to figuring out where performance bottle necks are. For simple cases when there is only one log file involved you can go very far with using grep/awk/sed magic or any decent editor capable of handling regex in large files.
It becomes tricky however when your logs are scattered through several files, maybe use different log format or stamp entries with different timezones. Fortunately there are services like Splunk, Loggly and many others that take away great amount of pain involved in aggregating distributed log entries and searching through them.
I was searching once for a free alternative that I could quickly get up and running in our test environment where we had 10+ machines running 20+ web sites or services that we’re all part of a single product. That’s when I found out about Kibana, logstash and how they make use of elasticsearch.
Back then I considered using fluentd instead of logstash however most of the machines we were running windows and that is not where fluentd shines. Nowadays I’m using linux vm mostly that’s why I decided to use fluentd.
Setup a vm for elasticsearch
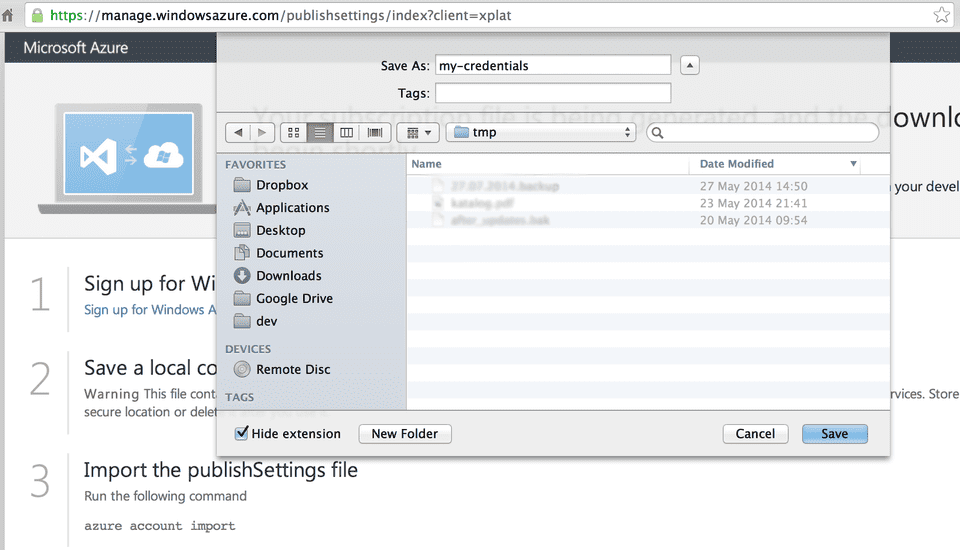
We need a machine that will store our aggregated log entries so let’s create one using Azure Cross-Platform Command-Line interface. After installing it with npm install azure-cli -g we need to introduce ourself to it. The simplest way to do this is to issue azure account download which will open a browser to download your profile:

npm account import /path/to/your/credentials.publishsettings.
I’m used to ubuntu so let’s find an machine image to use:
azure vm image list | grep Ubuntu-14
data:    b39f27a8b8c64d52b05eac6a62ebad85__Ubuntu-14_04-LTS-amd64-server-20140122.1-alpha2-en-us-30GB                          Public    Linux
data:    b39f27a8b8c64d52b05eac6a62ebad85__Ubuntu-14_04-LTS-amd64-server-20140226.1-beta1-en-us-30GB                           Public    Linux
data:    b39f27a8b8c64d52b05eac6a62ebad85__Ubuntu-14_04-LTS-amd64-server-20140326-beta2-en-us-30GB                             Public    Linux
data:    b39f27a8b8c64d52b05eac6a62ebad85__Ubuntu-14_04-LTS-amd64-server-20140414-en-us-30GB                                   Public    Linux
data:    b39f27a8b8c64d52b05eac6a62ebad85__Ubuntu-14_04-LTS-amd64-server-20140416.1-en-us-30GB                                 Public    Linux
data:    b39f27a8b8c64d52b05eac6a62ebad85__Ubuntu-14_04-LTS-amd64-server-20140528-en-us-30GB                                   Public    Linux
The last one looks like most recent so we’ll used that. Next we need to create a virtual machine. We can use either password authentication (which isn’t recommended) or a ssh certificate. To use the latter we need to create a certificate key pair first. Openssl command line tool will do it for us:
openssl req -x509 -nodes -days 730 -newkey rsa:2048 -keyout ~/.ssh/mymachine.key -out ~/.ssh/mymachine.pemIt’s now time to issue azure to create a new instance of Ubuntu machine for us:
azure vm create machine-dns-name b39f27a8b8c64d52b05eac6a62ebad85__Ubuntu-14_04-LTS-amd64-server-20140528-en-us-30GB machineuser \
  --vm-size extrasmall \
  --location 'North Europe' \
  --ssh 22 --no-ssh-password --ssh-cert ~/.ssh/mymachine.pem

info:    Executing command vm create
+ Looking up image b39f27a8b8c64d52b05eac6a62ebad85__Ubuntu-14_04-LTS-amd64-server-20140528-en-us-30GB
+ Looking up cloud service
+ Creating cloud service
+ Retrieving storage accounts
+ Configuring certificate
+ Creating VM
info:    vm create command OK
We can find out more details about our newly created machine with: azure vm list --dns-name machine-dns-name --json.
Our machine is up and running to so we can log into it using ssh (before you do that be sure to change .key file permission to 0600 so that only you can access it): ssh -i ~/.ssh/mymachine.key [email protected]
Install elasticsearch
First let’s download elasticsearch and extract it to our newly created vm:
curl https://download.elasticsearch.org/elasticsearch/elasticsearch/elasticsearch-1.2.0.zip -o elasticsearch-1.2.0.zip
unzip elasticsearch-1.2.0.zip
To run elasticsearch we’ll need java in version at least 1.7:
sudo apt-get update
sudo apt-get install default-jre
Now we can finally run elasticsearch:
./elasticsearch-1.2.0/bin/elasticsearchIf we want to run elasticsearch as a daemon we can pass -d to the script. (see below for init.d script)
We also need to open port for elasticsearch:
azure vm endpoint create --endpoint-name elasticsearch machine-dns-name 9200 9200We only wan’t our machines to be able to push logs to elasticsearch that’s why we need to add ACL rules to the endpoint we created above. Unfortunately I couldn’t find a way to do this through CLI interface so we need to resort to web interface.
Install Kibana
Kibana is a web application designed to perform elasticsearch searches and display them using neat interface. It communicates with elasticsearch directly that’s why it’s not really suited to be deployed to publicly accessible place. Fortunately there is kibana-proxy which provides authentication on top of it. To run kibana-proxy we’ll need node.js let’s install both of them:
sudo apt-get update
sudo apt-get install git
sudo apt-get install nodejs
sudo apt-get install npm

git clone https://github.com/hmalphettes/kibana-proxy.git
cd kibana-proxy
git submodule init
git submodule update
npm install
node app.js &
kibana-proxy is now running but in order to access it from outside we need to open firewall port:
azure vm endpoint create --endpoint-name kibana-proxy machine-dns-name 80 3003Now when you point your browser to http://machine-dns-name/ you should see kibana welcome screen.
Restrict access to kibana-proxy
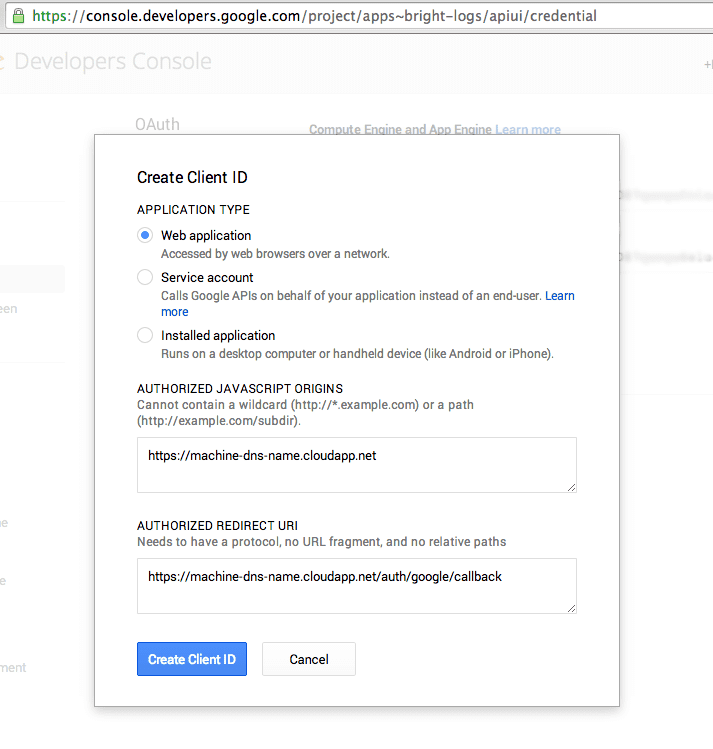
You probably don’t want anyone to be able to see your logs that’s why we need to setup authentication. kibana-proxy implements this through Google OAuth - so let’s enable it for our installation. First we’ll need APP_ID (Client ID) and APP_SECRET (Client secret) so let’s go to google developer console and create a new project. Next we need to enable OAuth for our project in APIs & auth > Credentials:

Make sure AUTHORIZED REDIRECT URI looks like http://machind-dns-name.cloudapp.net/auth/google/callback. For more secure setup you should be using https but for simplicity we’ll skip that.
Now we need to start kibana-proxy again this time passing it APP_ID, APP_SECRET along with AUTHORIZED_EMAILS through environment variables (kibana-proxy-start.sh):
export APP_ID=fill_me_appid
export APP_SECRET=fill_me_app_secret
export AUTHORIZED_EMAILS=my_email_list
exec /usr/bin/nodejs app.jsWe want to run the kibana-proxy continuously - the simplest way to achieve that is to make use of forever module. However in this guide we’ll use upstart scripts described below.
Fluentd installation
To push log entries to our elasticsearch instance we need fluentd agent installed on the machine we want to gather logs from.
Fluentd agent comes in 2 forms: fluentd gem if you wish to have more control features and updates and td-agent if you care for stability over new features. We’ll go with fluentd gem for this guide.
Since fluentd is implemented in Ruby with most performance critical parts written in C. To install it we need ruby first but obtaining it with rvm is a piece of cake:
curl -sSL https://get.rvm.io | bash -s stable
source ~/.rvm/scripts/rvm
rvm install 2.1.1
sudo gem install fluentd --no-ri --no-rdoc
sudo fluentd -s
Now we have fluentd installed with sample configuration available in /etc/fluentd/fluent.conf.
Since we would like our log entries to be pushed to elasticsearch we need a plugin for that too:
gem install fluent-plugin-elasticsearch
gem install fluent-plugin-tail-multiline
Let’s edit fluent.confg file so that our agents reads sample log files from rails app and forwards them to elasticsearch instance:
<source>
  type tail_multiline
  format /^(?<level_short>[^,]*), \[(?<time>[^\s]*) .(?<request_id>\d+)\]\s+(?<level>[A-Z]+)[-\s:]*(?<message>.*)/
  path /path/to/log/file/staging.log
  pos_file /path/to/positions/file/fluentd_tail.pos
  tag app_name.environment
</source>

<match app_name.**>
  type elasticsearch
  host machine-dns-name.cloudapp.net
  logstash_format true
  flush_interval 10s # for testing
</match>
The format we see above will following line of Rails log file:
I, [2014-05-22T12:24:44.434963 #11837] INFO -- : Completed 200 OK in 884ms (Views: 395.7ms | ActiveRecord: 115.0ms)and break it down to following groups/fields:
| Key | Value |
|---|---|
| time | 2014/05/22 12:24:44 |
| level_short | I |
| request_id | 11837 |
| level | INFO |
| message | Completed 200 OK in 884ms (Views: 395.7ms | ActiveRecord: 115.0ms) |
Note that although builtin in_tail plugin supports multiline log entries I either don’t completely understand how to use it or there is no way to have full stack trace logged as a single message. Moreover tail_multiline doesn’t seem to support multiple input paths that’s why in order to monitor multiple files you would have to duplicate the source section.
The only thing left is to start fluentd and watch our logs
rvmsudo fluetnd -dUpstart for fluentd, elasticsearch and kibana-proxy
The final thing we need to do is to setup above components to be run as services. Since we’re using Ubuntu for our servers we’ll use upstart congiurations for that.
Upstart for fluentd
Since we have installed fluentd in ubuntu user rvm but we wan’t we have to generate a wrapper script for it
rvm wrapper default fluentdand then use generated wrapper ~/.rvm/wrappers/default/fluentd in our upstart script.
Let’s create our upstart script and put it inside /etc/init/fluetnd.conf
description "Fluentd"
start on runlevel [2345] # All except below
stop on runlevel [016] # Halt, Single-User, Reboot
respawn
respawn limit 5 60 # Restart if ended abruptly
exec sudo -u ubuntu /home/ubuntu/.rvm/wrappers/default/fluentd
Upstart for elasticsearch
Elasticsearch already comes with a script for starting it in properly configured jvm we’ll utilize it in our upstart config /etc/init/elasticsearch.conf
description "Elasticsearch"
start on runlevel [2345] # All except below
stop on runlevel [016] # Halt, Single-User, Reboot
respawn
respawn limit 5 60 # Restart if ended abruptly
setuid ubuntu
exec /path/to/your/elasticsearch/bin/elasticsearch
Upstart for kibana-proy
With the kibana-proxy-start.sh the upstart configuration for kibana-proxy is dead simple:
description "kibana-proxy"
start on runlevel [2345] # All except below
stop on runlevel [016] # Halt, Single-User, Reboot
respawn
respawn limit 5 60 # Restart if ended abruptly
chdir /where/you/installed/kibana-proxy
setuid ubuntu
exec ./kibana-proxy-start.sh
Running services
Once you have your upstart scripts configuration ready you can now start services with a descriptive syntax:
sudo service elasticsearch startI you’re having trouble getting upstart to work you can always check its configuration with:
initctl check-configTo find out why a particular service won’t start check out
dmesg | grep elasticsearchFinally you can find you log files in /var/log/upstart/servicename.*
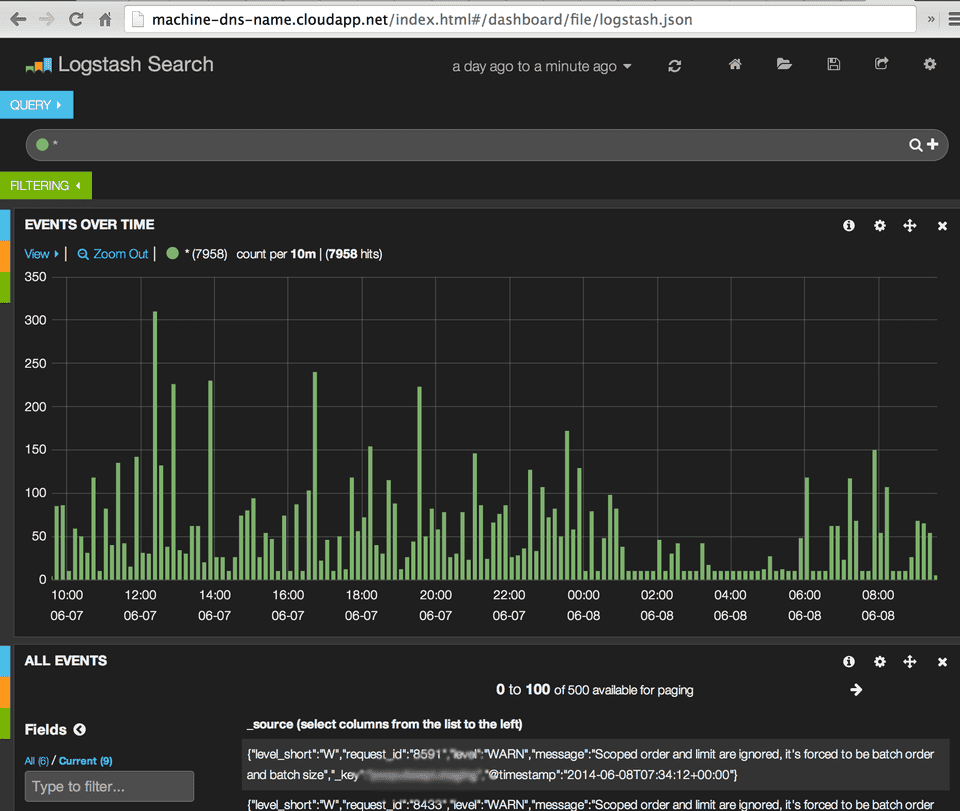
Now if you have setup everything correctly and of course you have some log messages generated by apps when you navigate to
http://machine-dns-name.cloudapp.net/index.html#/dashboard/file/logstash.json you should see a nice dashboard filling up with log entries:
